


Editor’s Note: This entire blog is about the new performance scoring we are doing on Stat Soldier. Once you finish reading, go visit www.statsoldier.com. Or do it now; we want the clicks.
If you have followed The Skippers View for a while, you probably remember when I decided to create my own baseball analytics.
It started with BBI, ABBI, and BBI+.
Too often, people use theoretical outcomes to explain away what actually happened on the field. Personally, I just want batting AVG, OBP, and SLG. But we live in the world of WoBA and BACOn (They capitalize letters when they feel like it!). So, if we are going to live in that world, I might as well have my own stat.
Then we needed somewhere to store all of it.
Enter Stat Soldier.
At first, the website was basically a place where I could check my rankings without having to rebuild everything every time. Then it grew. We added player comparisons, lineup cards, Top 10 lists, player cards, games, graphics, a live scoreboard, and data for every pitch and at-bat.
It has slowly grown over the last 12 months, and now we are scoring individual player performances.
Is the scoring perfect?
No.
Will we continue working on it?
Yes.
Does it give fans a better idea of who actually helped their team win than a basic box score does?
We believe it does.
Box Score vs Soldier Score
Let’s start with a pitcher.
Two pitchers throw 6 innings, rack up 8 strikeouts, and allow 2 earned runs. On paper, their stat lines match. But the Soldier Scores will be completely different.
Pitcher A: worked with low pitch counts, generated weak contact, carved hitters up with nasty stuff, and executed in high-leverage battles during a tight one-run game.
Pitcher B: labored through long counts, surrendered hard-hit outs, caught a few lucky breaks with runners advancing, issued free passes, and only padded his strikeout numbers once his offense blew the game wide open 8-0.
The box score will be pretty similar, but the Soldier Scores will not. A pitcher could theoretically post a high WPA simply because he lucked into high-leverage outs while surrendering hard contact and laboring through 100 pitches in 6 innings. Stat Soldier’s model weighs underlying quality so that the final grade reflects how well the player actually performed, not just the scoreboard's win-probability swing.
Now look at hitters.
A grand slam in a 15-1 game is great. But what about a single that drives in one run to tie it in the 9th inning and your team goes on to win?
Stat Soldier’s Performance Score gives you a simple score based on performance, high-leverage situations, and analytics to tell you how a player did rather than you needing to dig into the box score.
Understanding The Two Scales
Before I go any further, there are two different scoring scales you need to understand.
The Overall Performance Score
The main Performance Score crosses zero.
A positive score means the player added value.
A score around zero represents a neutral or ordinary performance.
A negative score means the player cost his team value.
The farther the number moves away from zero, the more significant the performance was.
This is the number we use to compare complete single-game performances.
A pitcher with a +42 had a gem. A hitter with a +28 probably had an All-Star-level game. A player with a -18 had a rough night.
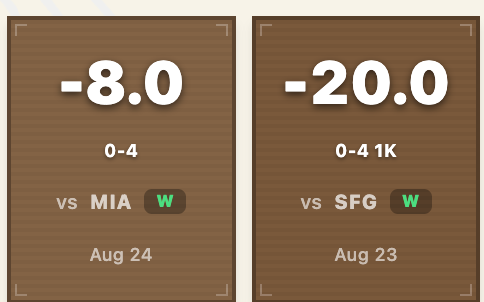
Here is the same player in back-to-back nights. You are probably wondering, “Wow, one strikeout leads to -12 points?” Nope, Willson Contreras just left more guys on base and didn’t work the pitch count up nearly as much in the -20 night.
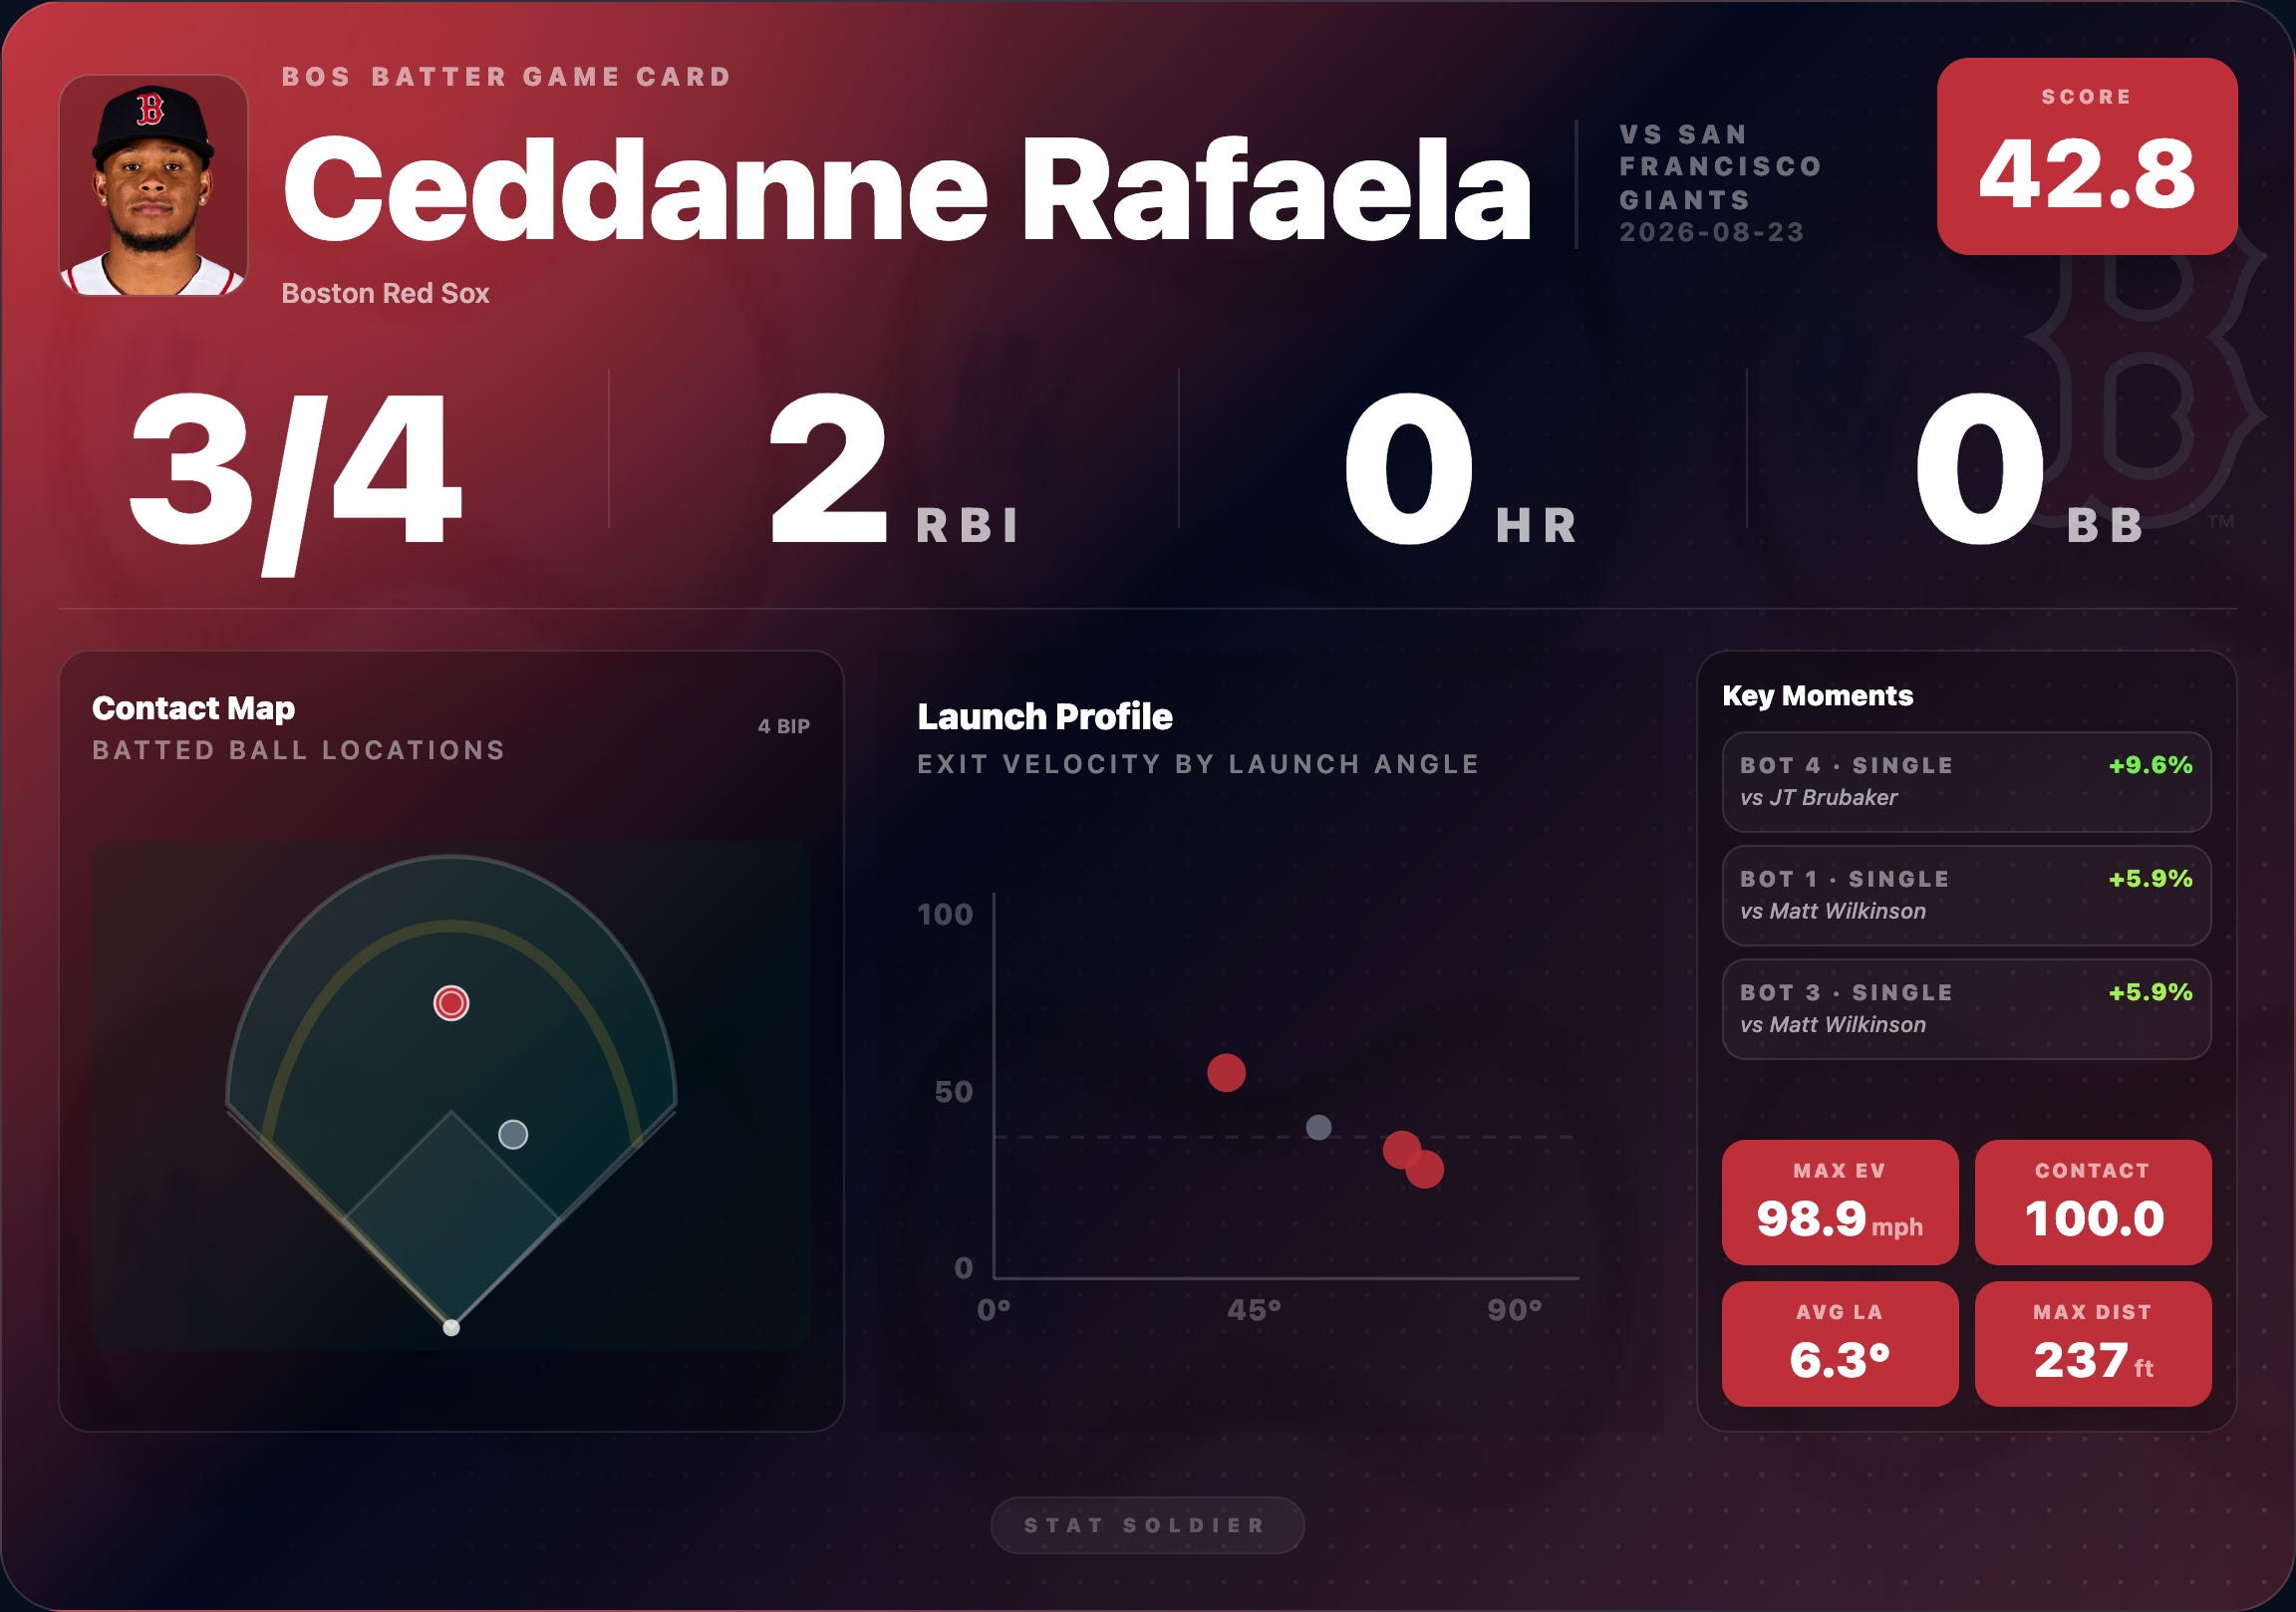
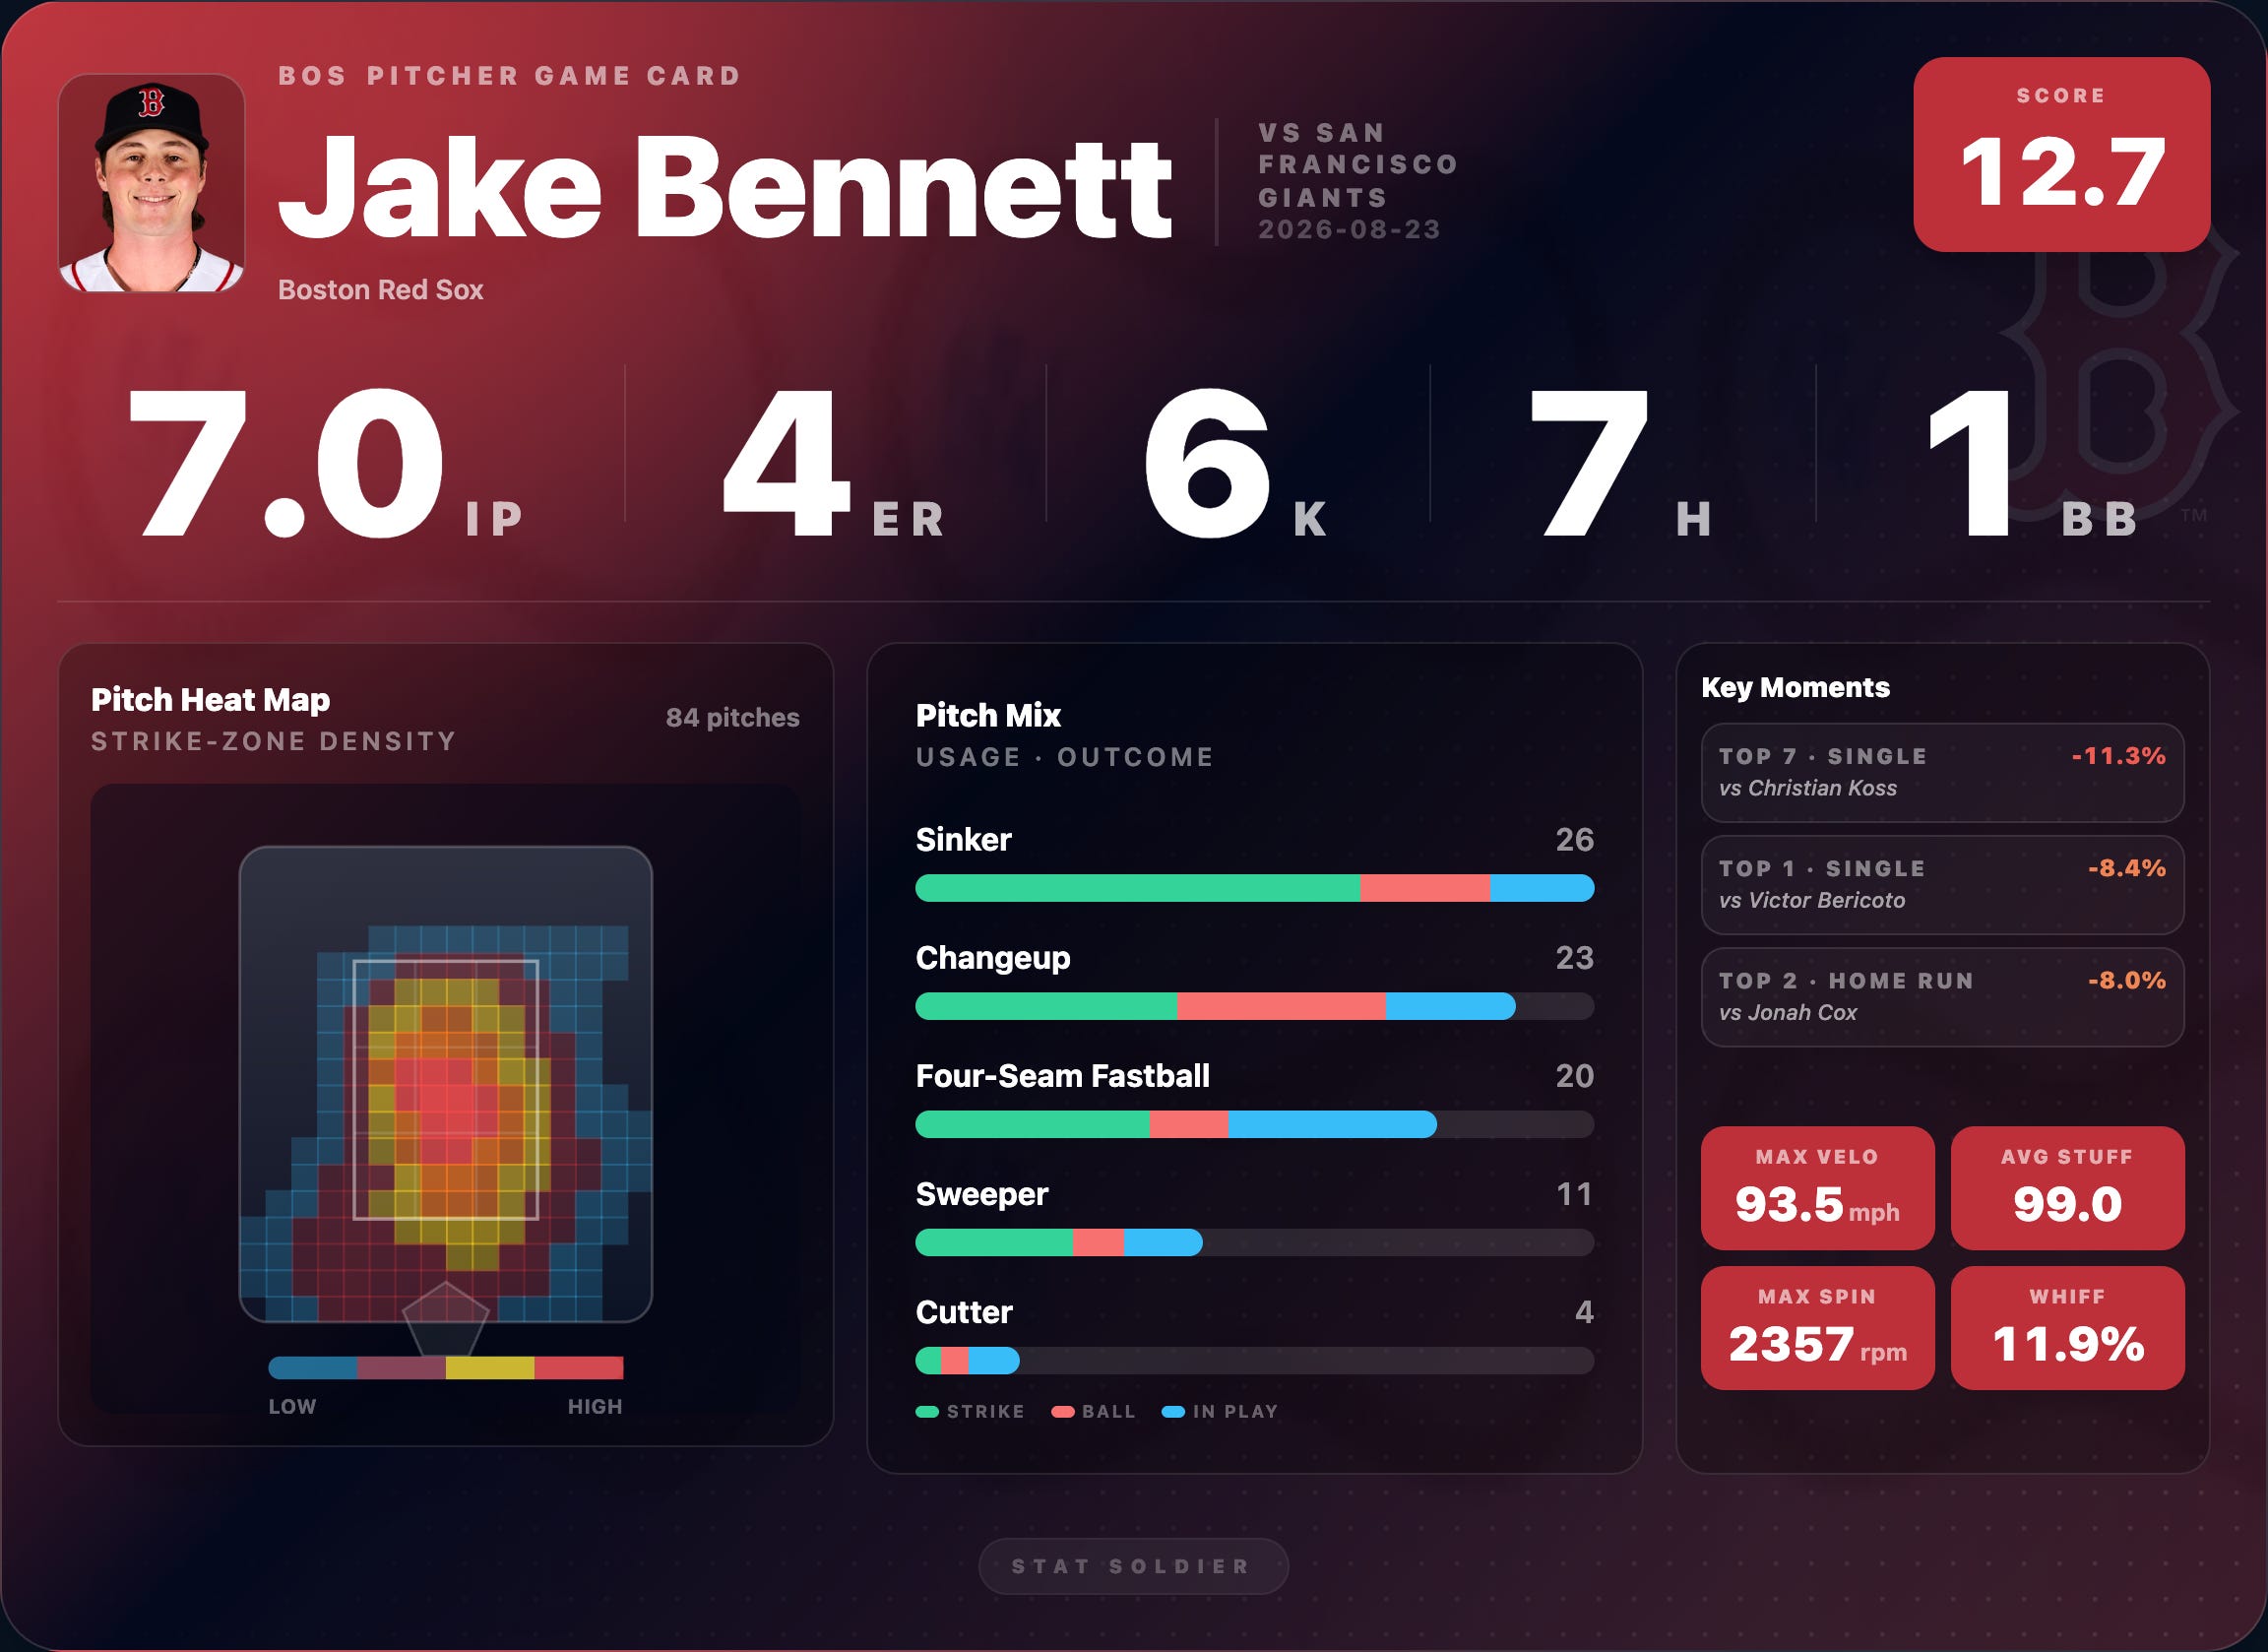
These are the player cards for individual games.
Ceddanne Rafaela had a great game, worked the count, and got hits with two outs that resulted in runs in a close game.
Jake Bennett had a “good, not great” performance. But he went 7 innings
The 0–100 Grades
The supporting grades are what help make up the overall performance score.
Stuff, Command, Contact, Discipline, and the other individual categories are graded from 0 to 100.
Those grades do not tell you the total value of the game. They explain the strengths and weaknesses behind the overall Performance Score.
Think of it this way:
The Performance Score tells you how good or bad the game was.
The 0–100 grades tell you why the player received that score.
How We Score Pitchers
A pitcher’s overall score is built from six main areas:
Workload and innings
Run prevention
Strikeouts and whiffs
Performance in high-pressure situations
Pitch efficiency
Pitch quality
Let’s break that down.
Workload Matters
A starting pitcher who records 21 outs gives his team something that a pitcher who records 12 outs does not.
He saves the bullpen.
That matters over one game, and it definitely matters over a 162-game season. Pitchers receive credit for every out they record, so working deeper into a game helps the score.
Think to the Bennett post above. He gave up four runs, but getting that one extra inning gives him a few extra points that let you know his performance wasn’t a disaster. Which…. it wasn’t. The score looks out for the workhorse guys who don’t get the same swing-and-miss action as others.
Runs Still Matter
I am not creating a statistic that tells you allowing six earned runs was secretly good because a pitcher had nice movement on his slider. Results still matter.
Pitchers lose points for earned runs and the damage they surrender. Home runs and extra-base hits are treated harshly.
Missing Bats Matters
We look at strikeouts, swinging strikes, whiff rate, chase rate, and the pitcher’s ability to finish an at-bat.
A pitcher who consistently overpowers hitters receives credit for it.
The Situation Matters
This is my favorite part of the scoring.
We use the pressure of the moment when evaluating what happened. Escaping a bases-loaded jam in a close game carries way more value than retiring the bottom of the order during a blowout.
Efficiency Matters
Was the pitcher attacking hitters and getting quick outs?
Or did every inning feel like it took 45 minutes?
Pitchers are rewarded for working efficiently and penalized for laboring through excessive pitches.
Saves and holds also receive extra credit because relievers enter the game with a different job than starters.
The Pitches Matter
We also evaluate the actual quality of the pitches.
Velocity. Movement. Location. Command. Pitch selection. Count management.
Did the pitcher execute the right pitch? Did he locate it? Did he get away with a mistake? Did he make a great pitch and get unlucky?
This is where tracking data and our internal formula get put to the test. We are still tweaking it, but it has gotten a lot better.
The Pitcher Performance Scale
Here is how to read a pitcher’s overall score:
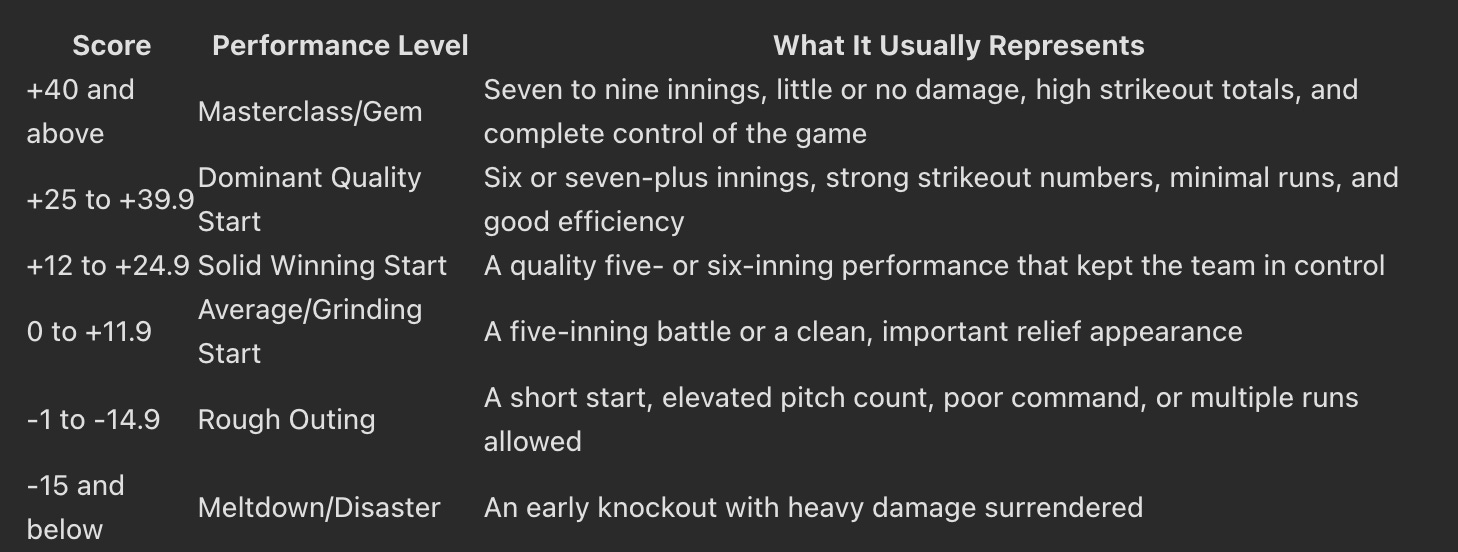
Along with the overall score, every pitcher receives 0–100 grades for:
Stuff
Command
Decision
Outcome
Dominance
Stamina
Velocity
Movement
A pitcher could have great Stuff and poor Command. He could receive a strong Outcome grade even though his underlying pitch quality was average. He could also have impressive Velocity and Movement without producing an effective outing.
How We Score Hitters
The Batter Performance Score follows the same basic idea.
What happened?
How well did the hitter execute?
When did it happen?
We evaluate five main areas:
Plate appearance results and run production
Clutch situations
Game-changing plays
Contact quality and plate discipline
Baserunning and defense
A double is worth more than a single. A home run is worth more than a double. Walks, strikeouts, double plays, and productive outs all affect the score differently.
Then we add context.
Did the hit give the team the lead? Did it tie the game? Was it a walk-off? Did the hitter come through with runners in scoring position?
We also look at exit velocity, launch angle, hard-hit contact, plate discipline, and the quality of the at-bat.
This connects directly to why I created BBI and BBI+ in the first place.
I do not want to look at a Baseball Savant page, see a bunch of red, and automatically decide a player is having a great year. I also do not want to look only at batting average and ignore whether the player is consistently driving the baseball.
Stat Soldier looks at both the quality and the production.
The Batter Performance Scale
The batter scale is slightly different because a hitter has fewer opportunities to affect a game than a starting pitcher.
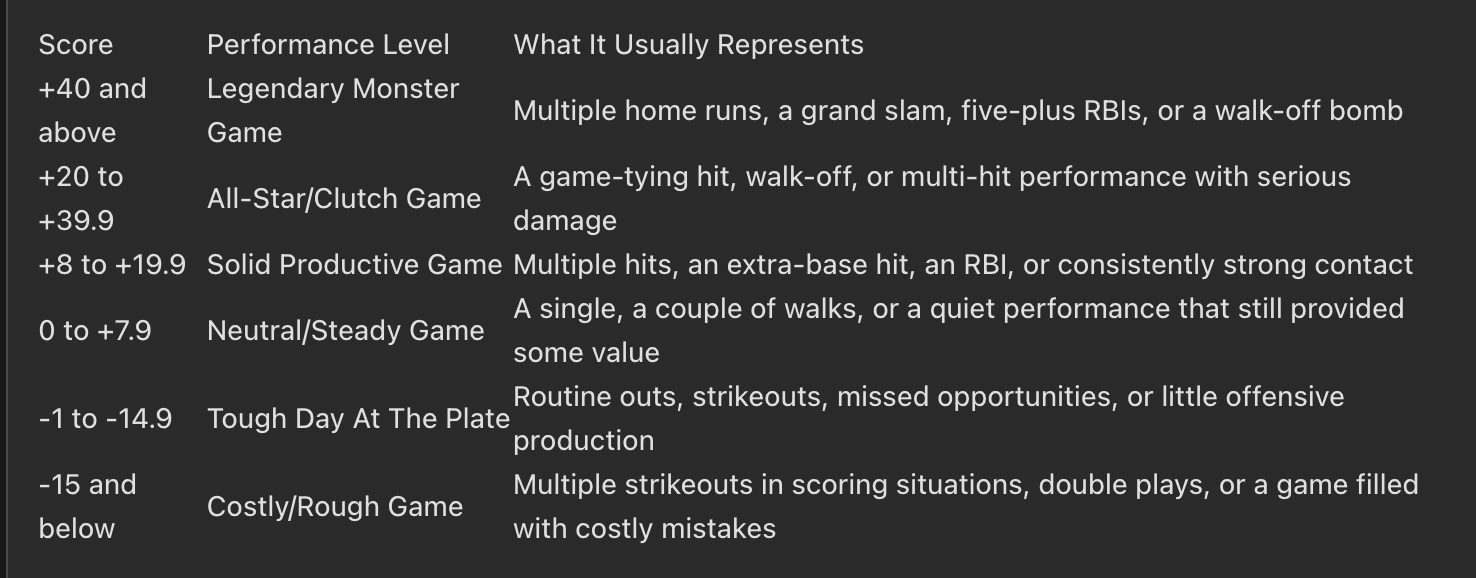
Hitters receive additional 0–100 grades for:
Outcome
Contact
Discipline
Situational performance
Once again, these grades explain the overall number.
Why We Did This
The goal of Stat Soldier has always been to make baseball data more useful and more accessible. You can look at one number and understand the night. Or you can spend an hour digging through every pitch and at-bat.
I do a little of both.
Stat Soldier started because we wanted baseball analytics that combined underlying quality with actual production.
These new Performance Scores are the next step in that evolution.
Alright, GO VISIT www.statsoldier.com.
If you haven’t already, please consider subscribing below!