Every year, baseball analytics ingrain themselves more and more into the mainstream. Whether that is good or bad is still up for debate. Regardless, they aren’t going away anytime soon. So, here is a list of some of the most common baseball analytics you will see and what they are.
Now, slight plug, I created my own analytics this year to better help me follow players. I combine several Savant metrics into one and get a score of 0-10. I lay out the explanations for each of them in the blogs below.
Check them out!
Hitting Analytics
WAR
(Wins Above Replacement) WAR is a comprehensive statistic that estimates the number of additional wins a player contributes to their team above what a replacement-level player would provide. Introduced comprehensively in the early 2000s, WAR is calculated differently by different organizations (e.g., FanGraphs, Baseball-Reference), considering both offensive and defensive contributions.
bWAR Leader- Aaron Judge 7.0
fWAR Leader- Aaron Judge 7.4
wRC+
(Weighted Runs Created Plus)Developed by Tom Tango, wRC+ is a rate statistic that quantifies a player's total offensive value and measures it by runs. Introduced in the late 2000s, it is adjusted for park effects and the era in which the player played, allowing comparison across different eras. A wRC+ of 100 is league average, while a wRC+ of 150 means a player created 50% more runs than the average player. Bryce Harper, for example, often records high wRC+ values, indicating his superior ability to produce runs.
League Average- 100
Current Leader: Aaron Judge 219
wOBA
(Weighted On-Base Average)Also developed by Tom Tango and introduced around the same time as wRC+, wOBA is a version of on-base percentage that gives different weights to hits, walks, and other methods of reaching base, more accurately reflecting the value of each. Unlike average or OBP, wOBA assigns value to the type of hit (single, double, etc.). For instance, a player like Juan Soto has a high wOBA due to his ability to hit for power and draw walks effectively.
League Average- .325
Current Leader: Aaron Judge .484
BABIP
(Batting Average on Balls In Play)BABIP measures how many of a player’s balls in play go for hits. It is useful for determining luck or skill changes in batting performance, as the league average is typically around .300. Players with a high BABIP might be getting lucky or might have skills (like speed or hitting style) that allow them to beat out infield hits. However, significant deviations from the norm often suggest forthcoming corrections in performance levels.
League Average- .300
Current Leader: Aaron Judge .425
OPS+
(On-base Plus Slugging Plus)OPS+ is an adjusted statistic that compares a player’s on-base plus slugging percentage (OPS) against the league average. It is normalized for league and park factors, with 100 always being league average. This means a player with an OPS+ of 120 is creating runs at a rate 20% better than the league average. OPS+ allows for comparisons between players in different parks and eras, making it a valuable tool for historical analysis.
League Average: 100
Current Leader: Aaron Judge (228)
BBI – Batting Boost Index
What it does: Measures a hitter’s raw offensive output using five core stats:
Batting Average
Home Runs per At-Bat
Slugging %
Exit Velocity
Barrel %
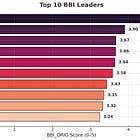
Current Leader: Aaron Judge 9.64
ABBI – Adjusted Batting Boost Index
What it does: Corrects for small sample sizes using regression to the league mean.
Adjustment Formula:
Adjusted Stat = (AB / (AB + 100)) * Player Stat + (100 / (AB + 100)) * League Avg
Then calculated like BBI using adjusted stats.
Current Leader: Aaron Judge 8.61
BBI+ – Enhanced Batting Boost Index
What it does: Adds plate discipline and contact quality for a full offensive profile.
10 Components:
AVG, HR/AB, SLG, Exit Velo, Barrel%
Hard Hit %, Sweet Spot %
K% (inverse), Whiff % (inverse), O-Swing Miss % (inverse)
Current Leader: Aaron Judge 6.42
xBBI – Expected Batting Boost Index
What it does: Evaluates swing quality independent of outcomes.
7 Components:
Exit Velo, Barrel %, Hard Hit %, Sweet Spot %
K% (inverse), Whiff % (inverse), O-Swing Miss % (inverse)
Current Leader: Aaron Judge 5.97
Pitching Analytics
xERA
(Expected Earned Run Average) xERA is a stat developed by Statcast, part of a suite of expected statistics (like xBA and xSLG) that attempt to remove defense and luck from the equation to evaluate a player's performance. Introduced around 2015 as part of the rollout of Statcast technology, xERA uses the quality of contact (exit velocity and launch angle) and actual strikeouts and walks to estimate what a pitcher's ERA should look like if typical outcomes followed the quality of the contact allowed. This helps to understand how well a pitcher should have performed independent of the defense behind them.
League Average: 4.00
Current Season Leader(Starter) Tarik Skubal, Zach Wheeler, and Eury Perez 2.38
Current Season Leader(Reliever) Adrian Morejon (1.80)
BABIP
(Batting Average on Balls In Play) Introduced formally into statistical analysis in the late 1990s and early 2000s, BABIP measures how many of a pitcher’s balls in play go for hits, excluding home runs. A typical BABIP is around .300, though it can vary significantly based on the defense and luck. BABIP is useful for predicting future performance; a very high or low BABIP suggests a potential regression toward the mean in the future. For example, a pitcher with a BABIP significantly lower than .300 might be getting lucky with defensive plays, and their performance might worsen as their luck normalizes.
League Average: .300
Current Season Leader: Carlos Rodon .226
FIP
(Fielding Independent Pitching) FIP was developed by Voros McCracken and became widely recognized in the early 2000s. It calculates a pitcher's effectiveness based solely on outcomes they most control: strikeouts, unintentional walks, hit-by-pitches, and home runs, assuming league-average results for balls in play. FIP is scaled to look like ERA, making it easier to compare the two. A pitcher with a low FIP but a high ERA might be experiencing poor defense or bad luck.
League Average: 4.00
Current Season Leader: Tarik Skubal 1.91
xFIP
(Expected Fielding Independent Pitching) xFIP is an advancement on FIP, introduced in the mid-2000s. It normalizes the fluctuation of home run rates by assuming each pitcher has a league-average home run-to-fly ball ratio. This can be particularly useful for assessing pitchers who play in home-run-friendly parks or during years when the home run rate fluctuates significantly across the league.
League Average: 4.00
Current Season Leader: Tarik Skubal 2.30
SIERA
(Skill-Interactive Earned Run Average) Introduced in 2011 by Matt Swartz and Eric Seidman, SIERA builds on FIP and xFIP by incorporating components that assess how pitcher skills impact outcomes on balls in play. It considers factors like the pitcher's ground ball to fly ball ratio and is better at predicting future pitching performance by recognizing the skill involved in inducing weak contact.
Current Season Leader: Tarik Skubal 2.32
xBA
(Expected Batting Average) xBA is another Statcast-driven metric, introduced as part of the advanced metrics wave in the mid-2010s. xBA uses exit velocity and launch angle of each batted ball to determine the likelihood that a ball will turn into a hit. For pitchers, a low xBA against suggests that they are effective at inducing poor contact, which can be a better indicator of skill than traditional batting average against, as it removes the elements of defense and luck.
Current Leader (Reliever): Josh Hader .154
Current Leader (Starter): Eury Perez .181
PBI
Current Season Leader: PBI – Pitcher Boost Index
What it does: Quantifies a pitcher’s dominance using performance & contact suppression metrics.
5 Components:
Strikeout %
Whiff %
Exit Velocity Against (inverse)
Barrel% Against (inverse)
xwOBA Against (inverse)
Current Leader: Tarik Skubal 9.32
PBI+ – Enhanced Pitcher Boost Index
What it does: Adds plate discipline and control for a fuller pitching profile.
10 Components:
All of PBI, plus:
O-Swing %
CSW % (Called Strikes + Whiffs)
BB% (inverse)
HardHit% Against (inverse)
Sweet Spot% Against (inverse)
Current Leader: Tarik Skubal 8.16
If you haven’t already, please consider subscribing below!


